For energy-intensive companies, understanding and anticipating natural gas price fluctuations is critical. And natural gas storage levels always feature prominently in qualitative comments on European gas markets.
It makes sense: low gas inventories should herald price tensions, while high gas inventories should create slack in the gas market.
But can quantitative analysis confirm that intuitive relationship?
Daily natural gas storage levels are part of the contextual data that Datapred processes to analyze and forecast EEX gas prices, so we have a positive answer to that question.
Let's take a look — focusing on TTF prices (Datapred users will find the same information for other European gas hubs in the Price drivers tab of the Markets > Analyses page).
Data
We are using the gas injection, storage and withdrawal data published on the Gas Infrastructure Europe website for most European gas hubs.
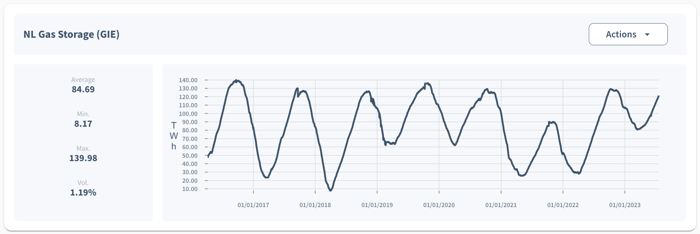
Here is, for example, the chart for historical gas storage levels in the Netherlands:
Findings
As usual, we are using Datapred to measure the contribution of that data to our ability to anticipate the corresponding gas prices.
We are doing this EEX product by EEX product, since the factors affecting spot prices should differ from the factors driving long-term futures prices.
We are also doing this analytical horizon by analytical horizon: the factors affecting prices a few days ahead should differ from the factors driving prices multiple months from now.
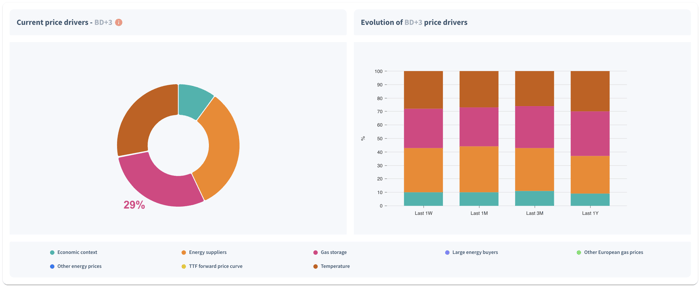
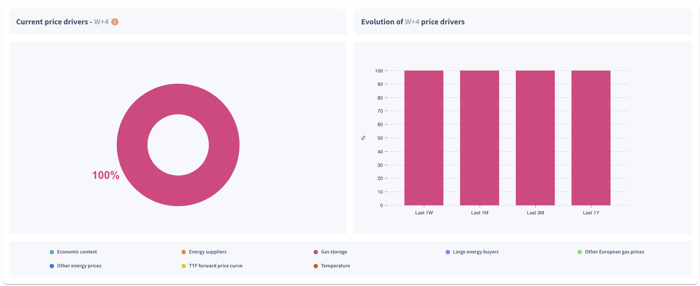
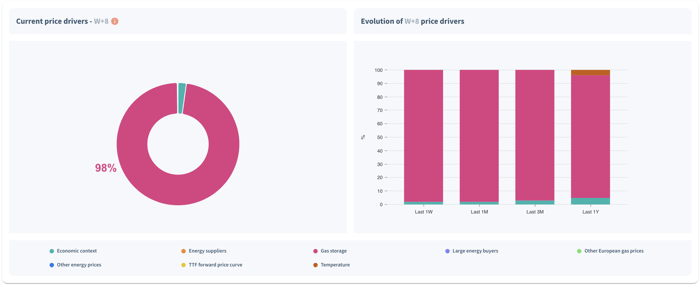
In the following discussion of our findings, the pie charts on the left show the 5 largest price drivers as of today, and the bar charts on the right show how price driver importance has evolved during the past 12 months.
TTF Day Spot prices
Showing the contribution of gas storage data to our understanding of price movements 3 business days, 4 weeks and 8 weeks ahead.
Source: Datapred.
So on the whole, a major contribution of gas storage data to the modeling of TTF Day Spot prices.
TTF Month 1 future prices
Showing the contribution of gas storage data to our understanding of price movements 1 business day, 1 week, 4 weeks and 8 weeks ahead.
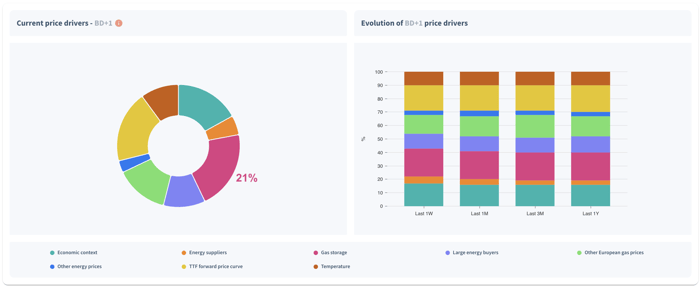
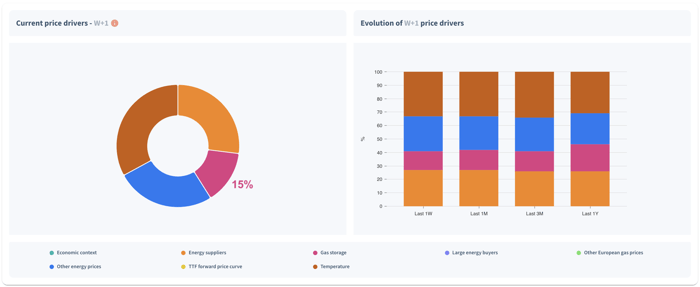
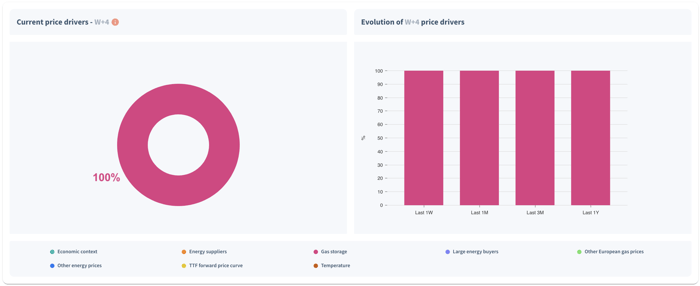
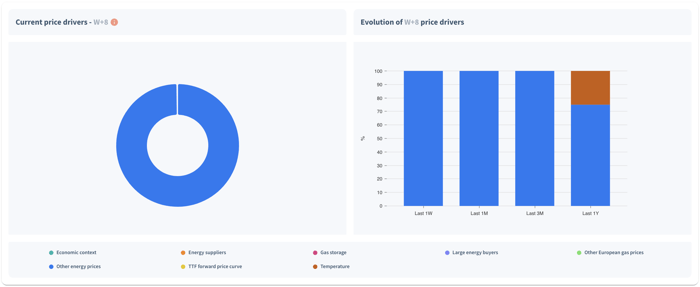
Source: Datapred.
For shorter horizons, the contribution of gas storage data to our understanding of TTF Month 1 future price movements is inferior to what we see with TTF Day Spot prices.
The contribution is major for four-week price movements.
It disappears entirely beyond that horizon.
TTF Calendar 1 future prices
Showing the contribution of gas storage data to our understanding of price movements 1 business day, 1 week, 4 weeks and 8 weeks ahead, as we just did with TTF Month 1 future prices.
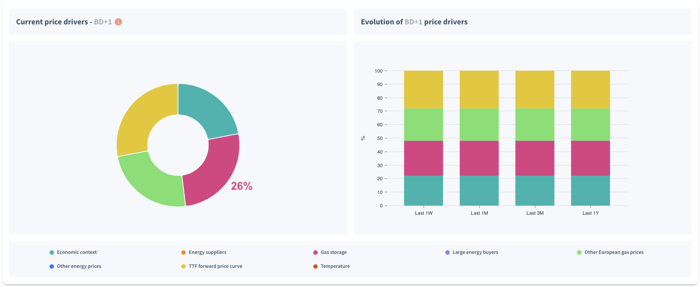
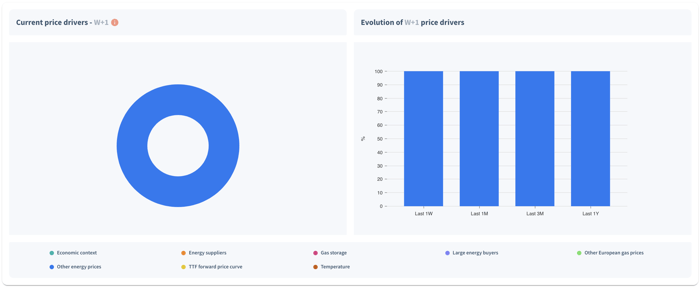
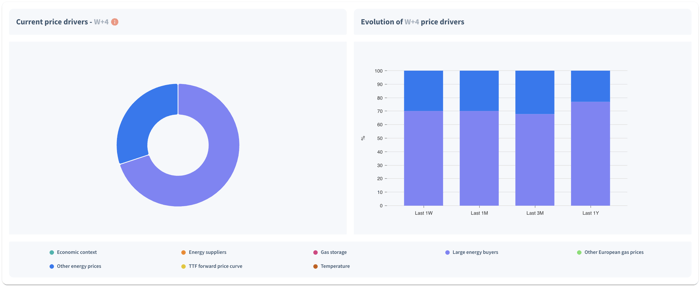
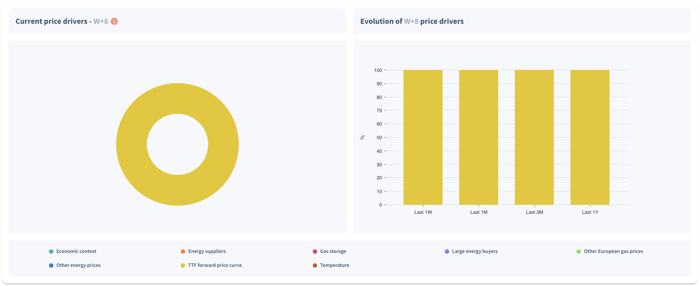
Source: Datapred.
Here, we can only quantify a contribution of gas storage data to our understanding of price movements one day ahead.
Beyond that, structural factors like other energy prices, supply and demand, and the overall forward price curve for gas become more meaningful.
Conclusions
We can draw two conclusions from this analysis:
- First, gas storage data is generally useful. It's a good idea to add that input to gas price models — especially since open sources are available.
- Second, the importance of that data varies greatly from EEX product to EEX product, and from analytical horizon to analytical horizon. It seems that gas injections, withdrawals and storage levels are most significant around the 1 month mark: for month 1 futures, and 4 week horizons.
The ability to adapt modeling dynamically to countries, products and analytical horizons is thus key to make the most of gas storage data.
Don't hesitate to contact us for a discussion of how Datapred does this, and how industrial energy buyers benefit.
You can also visit this page for additional resources on energy procurement.
